Law of supply and demand

The term refers to a microeconomic concept that in efficient markets, the quantity supplied of a good and quantity demanded of that good are equal to each other.
The price of the good is determined by the point where supply equals demand. Typically, supply and demand are represented in a line graph format, with Quantity on the y-axis (independent variable) and Price on the x-axis (dependent variable).
Supply
In general, the supply of a good is directly proportional to its price, exhibiting a linear relationship. This means that as the price increases, the supply of the good also increases, as illustrated in the chart below:
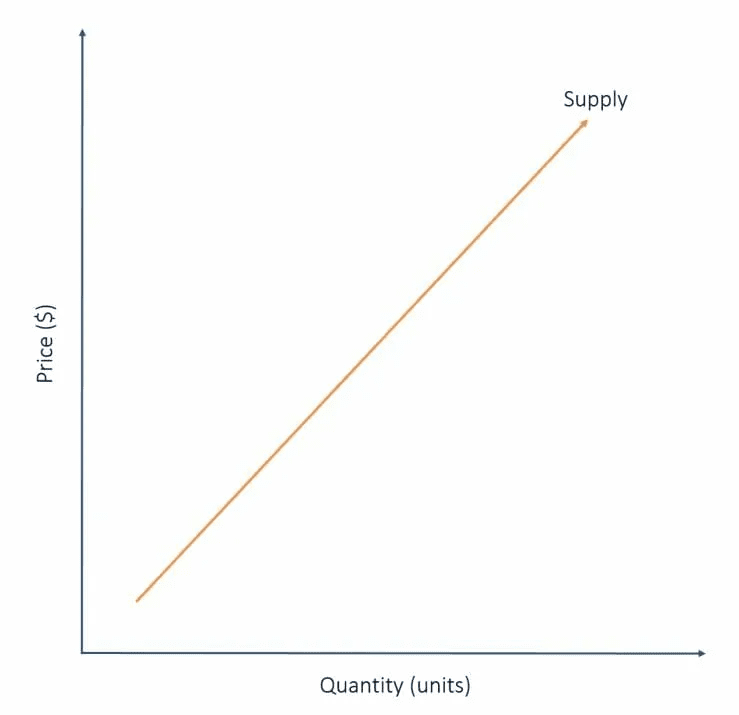
The supply line reflects the seller’s viewpoint. A higher price for a good incentivizes sellers to offer more of that good, as it becomes more profitable. Conversely, a lower price is less attractive to sellers, resulting in a lower quantity supplied.
Demand
Demand operates inversely to supply and is inversely proportional to price. Put simply, as the price increases, the demand for that good decreases, as shown in the chart below:
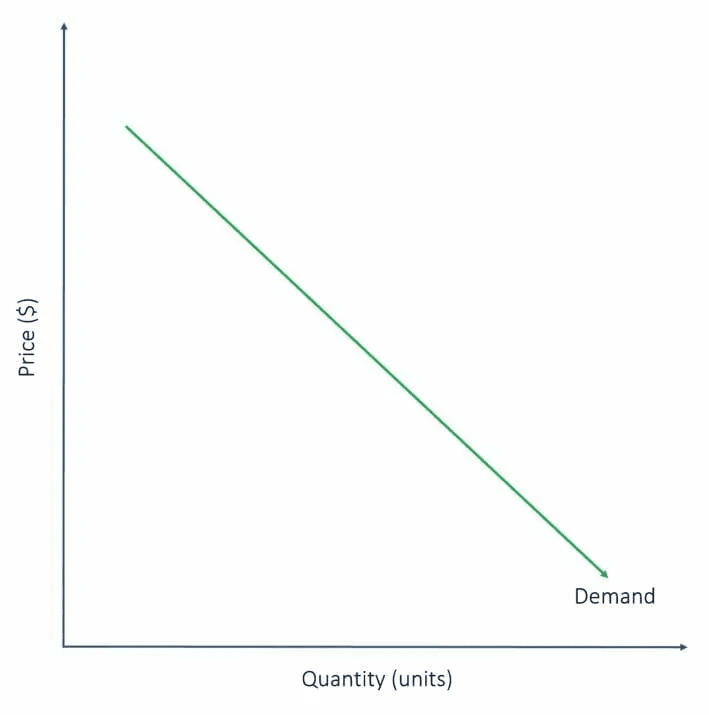
The demand line is viewed from the buyer’s standpoint. As the price of a good rises, the number of interested buyers decreases, as buyers seek to save money. On the flip side, a lower price attracts more buyers to the market, resulting in a higher quantity demanded.
Supply and demand graph
Is a combination of both of the previously introduced concepts.

Combining both graphs allows us to identify the equilibrium point, where the supply and demand lines intersect. Drawing lines from this point to the x- and y-axes reveals the Price at Equilibrium (Pe) and Quantity at Equilibrium (Qe), respectively.